Python code to convert FITS files to images (including the OpenEXR format) - Min-Su Shin (msshin @ kasi.re.kr)
I present a simple Python code to scale FITS images by
using linear, sqrt, pow, log10, asinh function, zscale, logistic distribution
as well as histogram equalization, and then save them to
image files such as PNG. The code also
includes simple methods to measure sky levels and to find
adequate ranges of pixel values for the scaling routine.
I hope that the code is useful in your works. I always welcome comments. Please,
note that these Python codes are presented as examples rather than
a complete software package. The img_scale.py can be easily incorporated to
your own code for various scaling methods. In the given examples, you can figure out how
several Python graphics modules (SciPy, Matplotlib, and Python Image Library) can be used
to convert FITS files to conventional image files.
The image scaling is given in the module file img_scale.py. There are multiple
example Python codes that generate RGB color images and
generate single-band images.
Please, read
Lupton et al. (2004) about how to produce RGB images and scaling methods, and
Lupton et al. (1999) about the asinh scaling. If you are looking for
general introduction to this problem, you may find the Youtube
video explanation
"How scientists colorize photos of space" useful.
The code presented here is not for interactive production of images. I also suggest people to check
STIFF,
which is quite useful in producing high-quality picture files,
APLpy, and
dmimg2jpg
in CIAO, which support multiple scaling relations to produce RGB images.
f2n.py is
also a simple useful tool written in Python to convert FITS images
to PNG files by using Python Image Library.
Conversion from astronomical images to conventional images consists of two steps
as commonly used in tone mapping with high dynamic range images.
In the first step, you can change the pixel values of FITS images to values
between 0.0 and 1.0 by using img_scale.py. In the second step,
these values are divided into 256 intervals for 8bit images, and then are saved as graphic files.
Download : public_fits_image.tar.gz
The above file has example codes and FITS files as example data,
as well as img_scale.py. The code needs
NumPy.
PyFITS is also required to read FITS files.
The code build_rgb_w_asinh_SciPy.py uses
SciPy to produce image files.
Meanwhile, the code build_single_matplotlib.py
and
build_rgb_w_asinh_matplotlib.py use
Matplotlib
instead of SciPy.
If you want to use
Python Image Library (PIL)
instead of Matplotlib and SciPy,
check build_rgb_w_asinh_PIL1.py or
build_rgb_w_asinh_PIL2.py.
When you want to change color maps for a single-band image by using Matplotlib,
look up the tables for the color maps
(1D
and 2D).
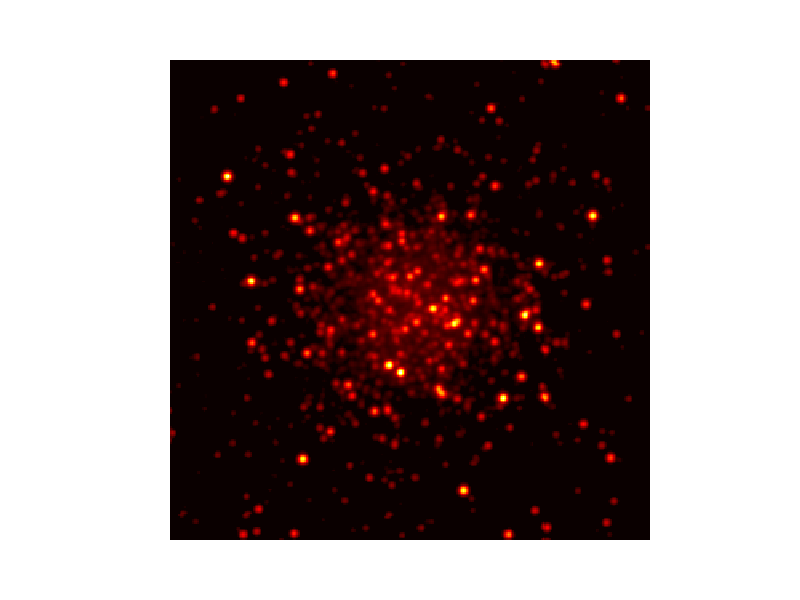
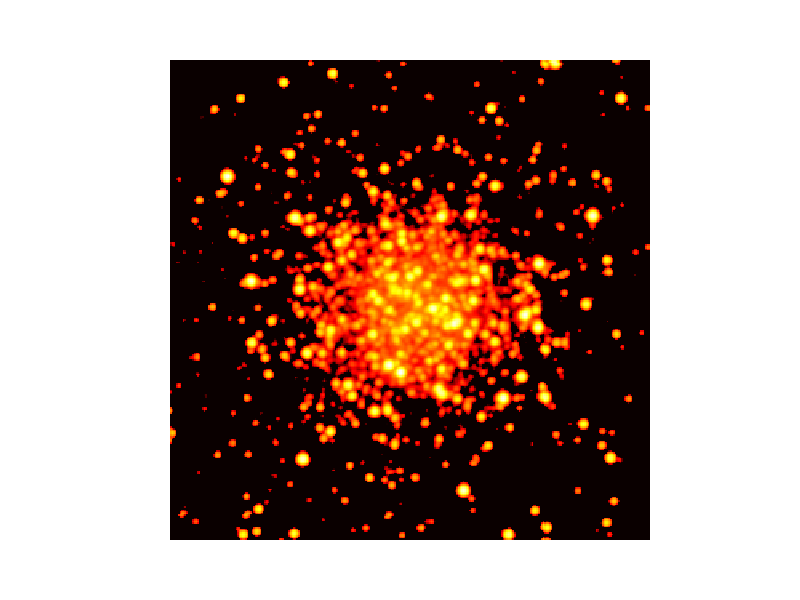
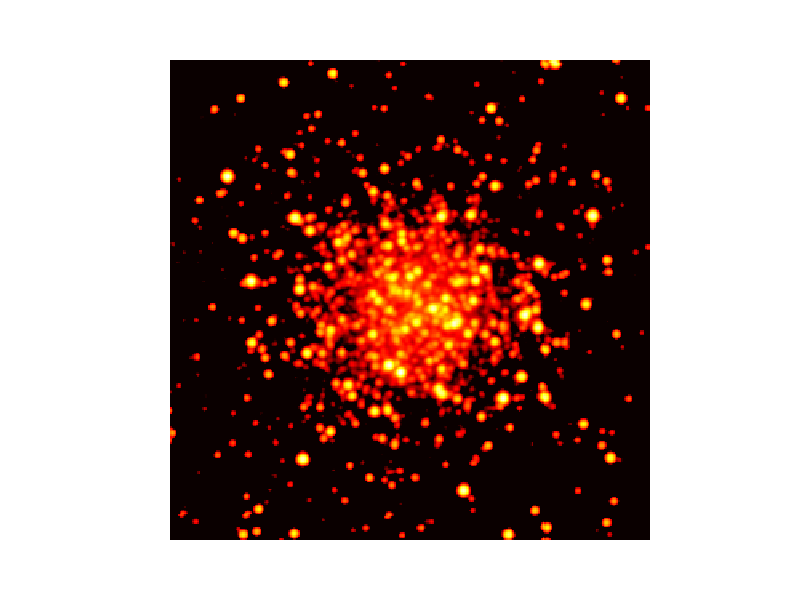
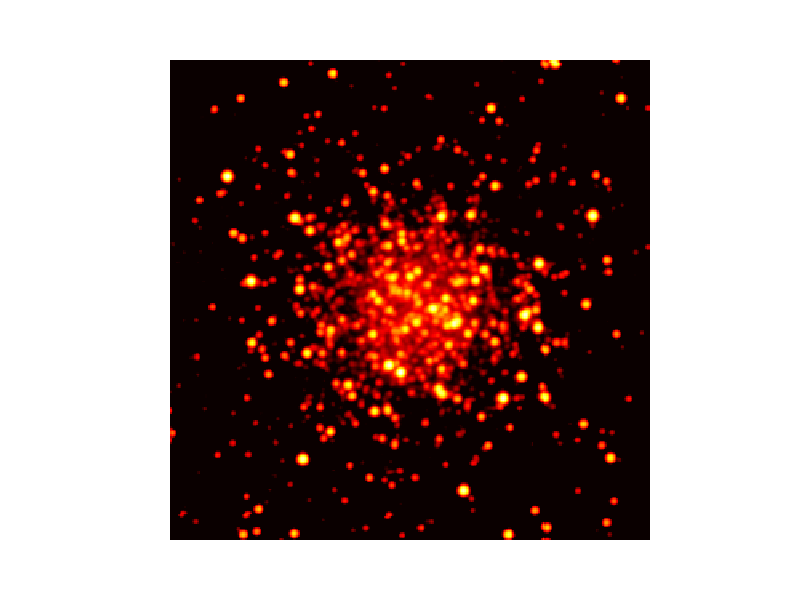
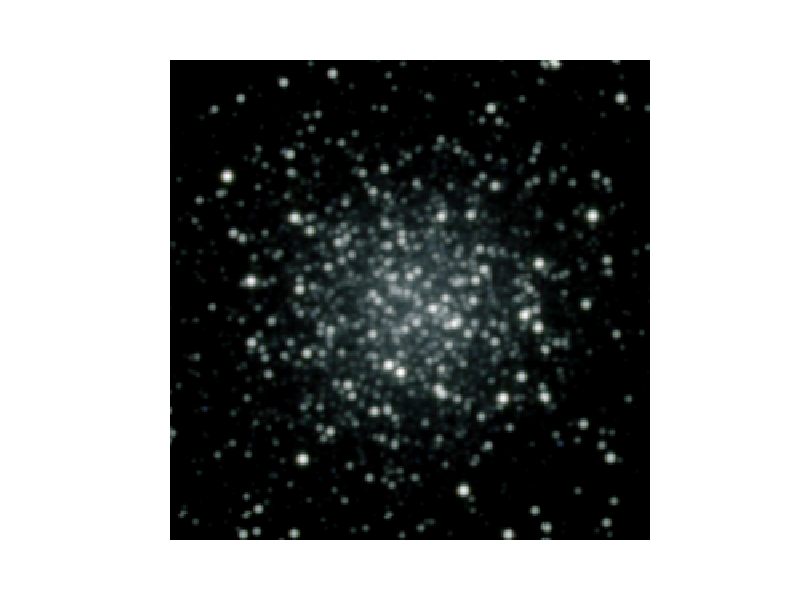
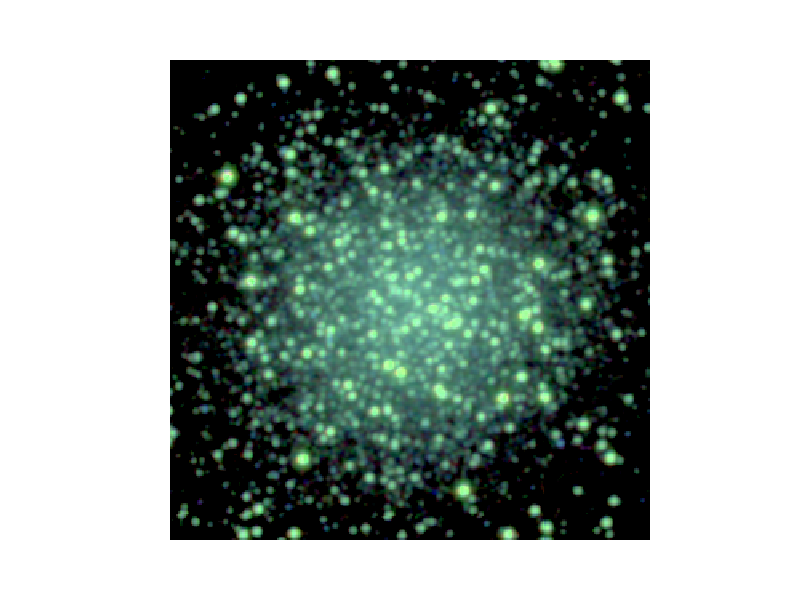
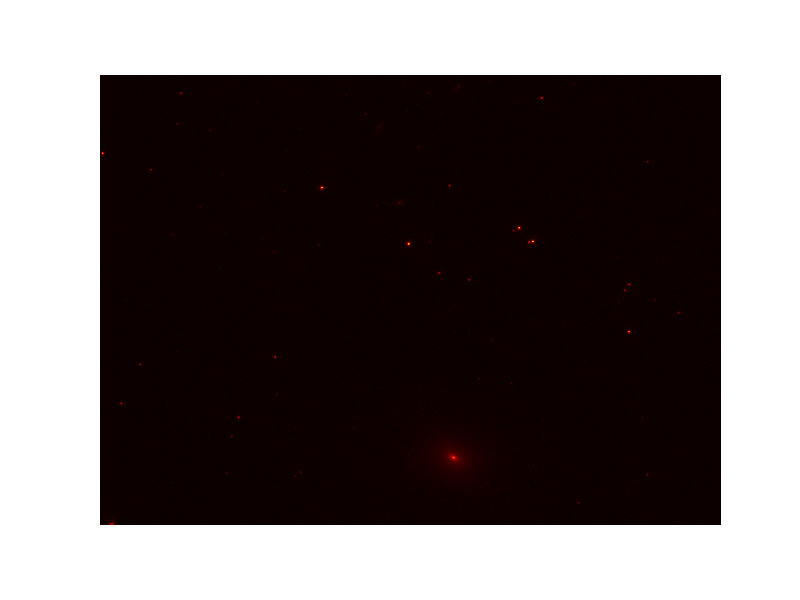
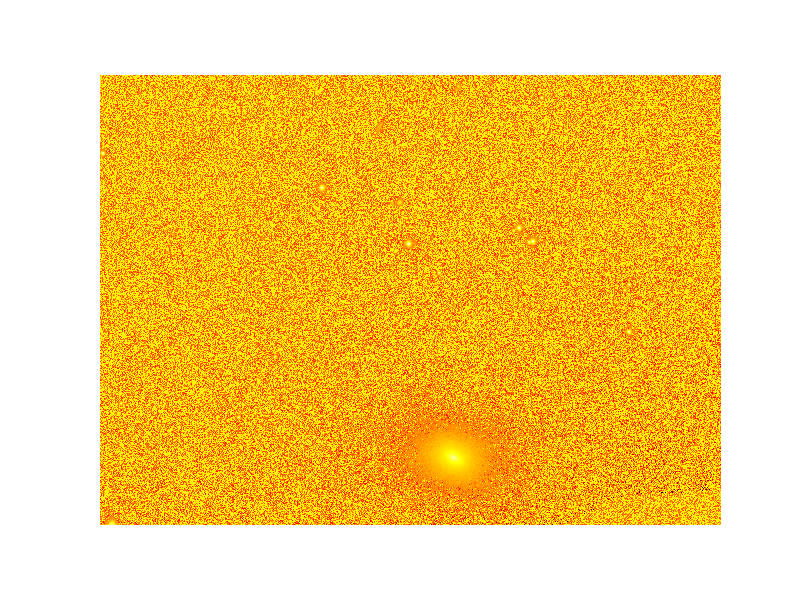
The following are example pictures.
When producing the following pictures, the pixel values of the FITS files were scaled down
to some ranges which are divied into 256 intervals equally. Pixel values for images are
assigned as nearest value for the 256 intervals. You might be interested in
Matplotlib color maps
to visualizae a single-band image by using Matplotlib. You also might be interested in
interactive tools which can read high-dynamic range FITS images and can convert them to other
formats. DS9 and
Aladin
are well-known tools in the astronomy community. ImageJ can be also used
for this purpose with lots of image analysis methods.
* FAQ
- How can I change the size of output images?
If you use Matplotlib to produce images, use the statements such as the following:
fig = pylab.gcf()
fig.set_size_inches(3.4,3.4)
rgb_array[:,:,0] = r
rgb_array[:,:,1] = g
rgb_array[:,:,2] = b
print "Plotting a RGB image of (", width,",",height,")"
pylab.imshow(rgb_array, interpolation='nearest', origin='lower')
pylab.axis('off')
pylab.savefig(out_fn, dpi=(300))
where sizes are given in inches, and dpi is set to change the resolution. If you use
Python Image Library to generate images, you can use resize function as the following does.
use_image = Image.new('RGB', size=(height, width))
use_image.putdata(PIL_data)
use_image = use_image.resize((height/2,width/2))
use_image.save('rgb.png')
SciPy also supports the resize function as the following shows if you want
to use SciPy instead of Matplotlib or PIL.
rgba_array = numpy.empty((width,height,4), numpy.uint8) # assuming 8 bits per channnel
rgba_array[:,:,0] = scipy.misc.bytescale(r) # red
rgba_array[:,:,1] = scipy.misc.bytescale(g) # green
rgba_array[:,:,2] = scipy.misc.bytescale(b) # blue
rgba_array[:,:,3] = 255 # Alpha transparency
rgba_array = scipy.misc.imresize(rgba_array, (width/2, height/2), interp='bicubic')
scipy.misc.imsave('rgb.png', rgba_array)
- Some examples produced by others
- How can I produce a single-band image instead of a RGB image?
Check the example Python codes build_single_matplotlib.py,
build_single_PIL_w_matplotlib.py, and
build_single_Gnuplot.py which are included in the above tar.gz file. In principle,
there are many ways to produce a single-band image after scaling by using img_scale.py. The
example codes just show two possible ways.

linear
sqrt

log10
asinh(beta=1.0)
asinh(beta=5.0)
asinh(beta=20.0)
RGB type 1
RGB type 2

linear
sqrt
log10
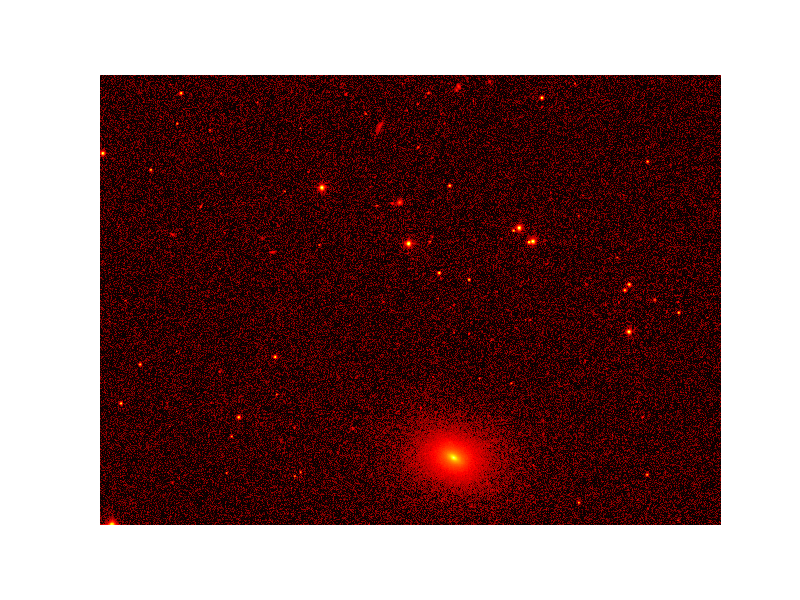
asinh(beta=1.0)
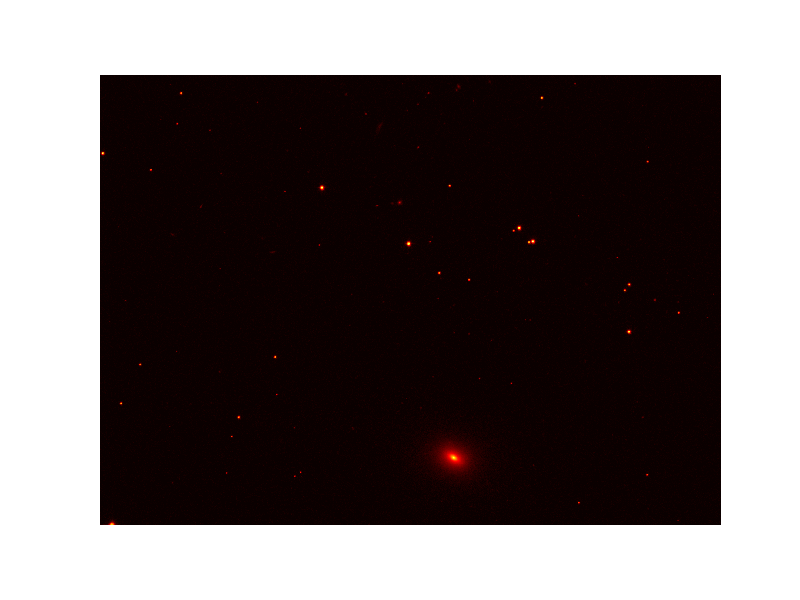
asinh(beta=5.0)
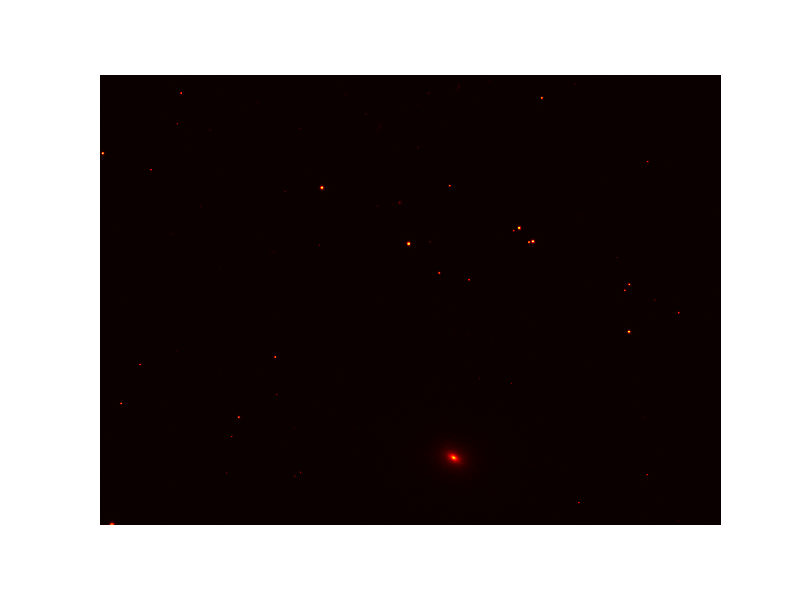
asinh(beta=20.0)
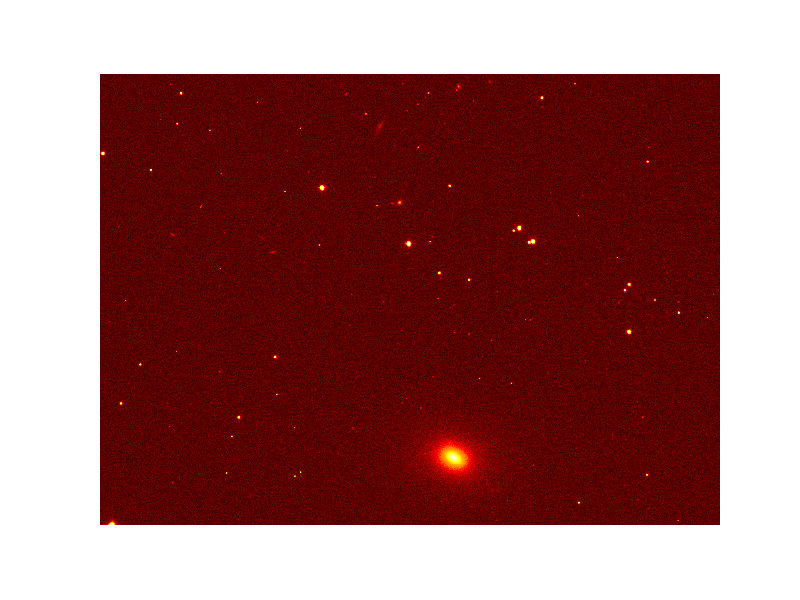
histogram equalization
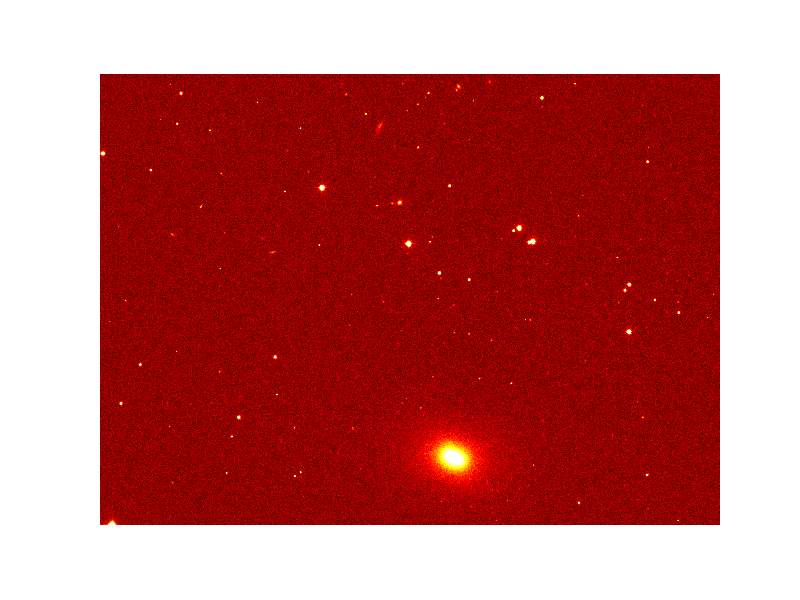
logistic distribution
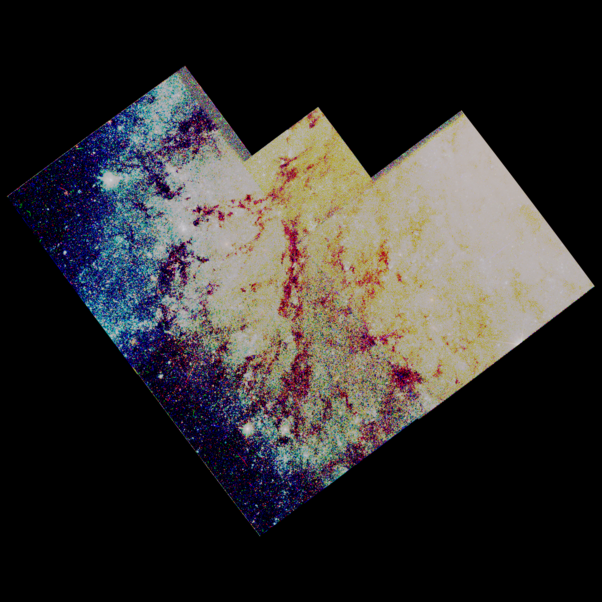
RGB type 1
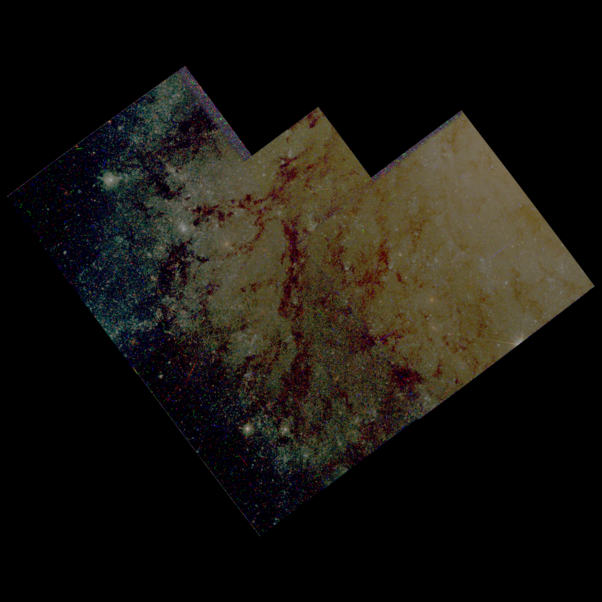
RGB type 2
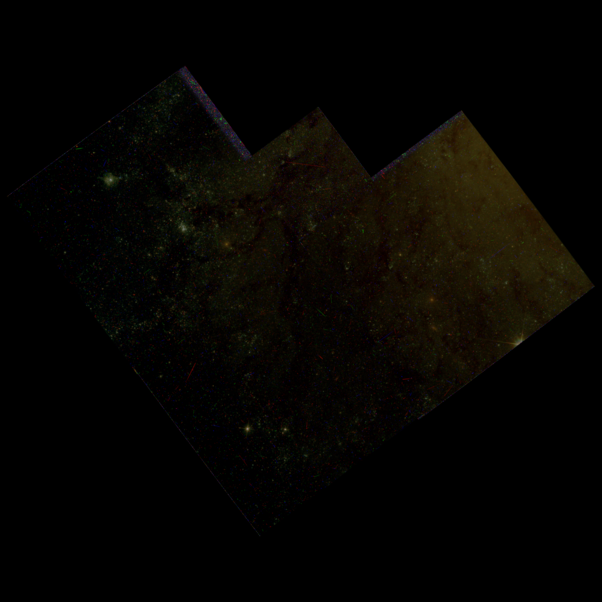
RGB type 3
* Conversion to the OpenEXR format
It is also possible to convert FITS files to OpenEXR files, and then you can use tools for high dynamic range (HDR)
images. The file fits2exr.py shows how you can do the conversion with PyFITS and Python
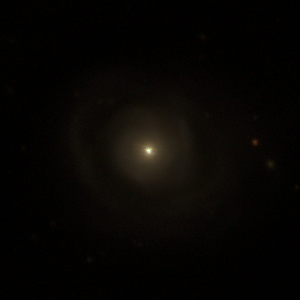
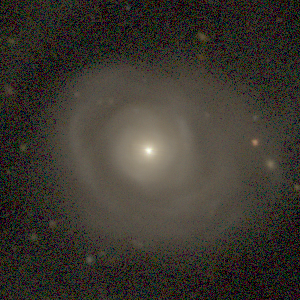
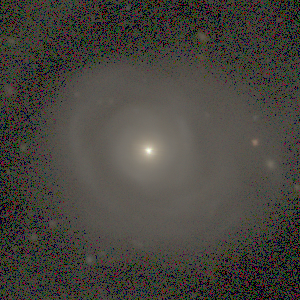
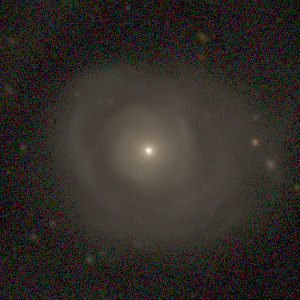
binding of the OpenEXR library. The following images show how the converted EXR files can be used with
exrtools.
The original FITS files are SDSS DR8 images of
NGC 5548 in g, r, and i-bands.
|
exrnormalize galaxy.exr galaxy.n.exr
exrtopng galaxy.n.exr galaxy.n.png
|
|
exrpptm -c 1.0 galaxy.n.exr galaxy.pp.exr
exrnormalize galaxy.pp.exr galaxy.pp.n.exr
exrtopng galaxy.pp.n.exr galaxy.pp.png
|
|
exrblur galaxy.n.exr galaxy.b4.exr 0.25
exrchr galaxy.n.exr galaxy.b4.exr galaxy.chr.exr 0.1
exricamtm galaxy.chr.exr galaxy.b4.exr galaxy.icam.exr
exrnormalize galaxy.icam.exr galaxy.icam.n.exr
exrtopng galaxy.icam.n.exr galaxy.icam.png
|
|
exrnlm galaxy.n.exr galaxy.b4.exr galaxy.nlm.exr
exrtopng galaxy.nlm.exr galaxy.nlm.png
|
If you want to see the converted EXR image of NGC 5548 by using HDR HTML viewer which is
generated by pfsouthdrhtml of pfstools,
click here!
ImageMagick and
GEGL also support the OpenEXR format.
Luminance HDR (a.k.a. Qtpfsgui) is a wondergul GUI
program to process HDR images including OpenEXR and FITS formats. If you are looking for a tool to
visualize FITS on Web interactively, you may find JS9
and jsFITS
interesting.


